PAMET PROGRESS!
We’ve been mapping like crazy here at the Olmsted Center. After a little over a week of diligent work in AutoCAD, I’m happy to report that the site plans for the Pamet Cranberry Bog at Cape Cod National Seashore are coming along nicely!
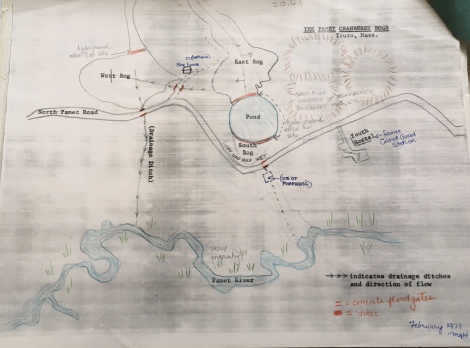
The process of mapping the Pamet bogs started out by following a paper trail of reports and other written documents from the NPS archives. These will come largely into play when I begin writing the Cultural Landscape Inventory report that will go along with my site plans, but they also formed the basis for my initial understanding of the site. The 1979 hand-drawn map below that was part of this research was a great starting point that really helped to clarify the layout and key features of the cranberry bogs as I prepared to start building my maps in AutoCAD…
From this more traditional, “book-based” phase of research, I began to gather together photos and other geographic and spatial data that would help visually inform my site plans. The photos and field notes we produced during our visit to Cape Cod in June were a first essential piece of the puzzle, full of first-hand observations and measurements that I could reference for my drawings. Here are two of the notated site plans from our field work on the Cape that proved to be particularly useful (Many thanks to Melissa’s and Jill’s groups for these!).

In my blog post last week, I expressed a longing for more traditional (some might say “old-fashioned”) ways of creating site plans, but the ready availability of detailed, accurate, and up-to-date geographic and spatial data online is one of the many ways in which computer drafting is such an improvement over older methods. Laser scans, property boundaries, and detailed aerial images – all of them were only a few clicks away.
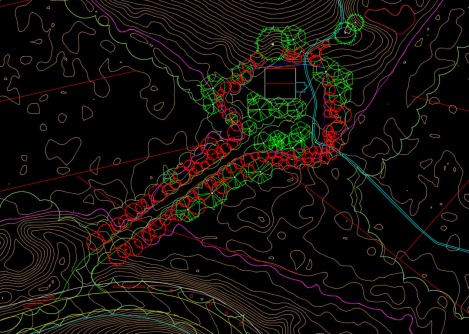
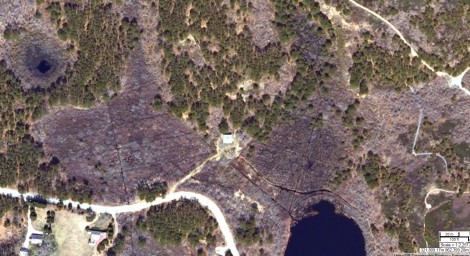
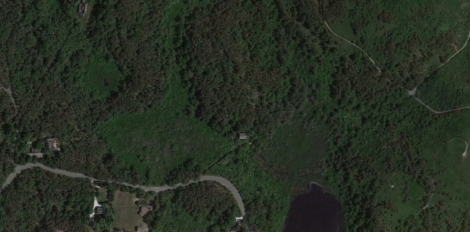
Using websites, such as the Massachusetts Office of Geographic Information (MassGIS), I was able to compile a collection of aerial images of the Pamet site from the last 20+ years. Having access to images from a range of years and seasons has been invaluable to my drafting process. Images that were captured during the winter months offered much clearer views of features that might otherwise have been hidden by the dense tree growth (such as trails leading through the surrounding hills), while images taken during the summer showed the full extent of the tree canopy. Perhaps most importantly for the Pamet Cranberry Bog, these aerial photographs helped me to accurately locate the old drains and canals that had been used to irrigate the cranberry plants and flood the bogs during the winter months.
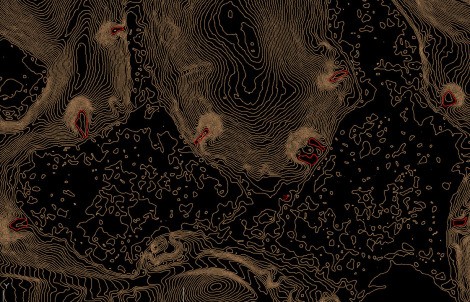
Topographic data has also helped me to locate key features that would have been difficult and time-consuming to find, such as a series of sand pits that line the perimeter of the bogs. These sand pits (outlined in red in the topographic image below) would have been used to periodically spread sand over the cranberry fields to control weed growth. Features such as these would have been a challenge to locate in person due to the site’s extremely overgrown condition and its large scale. With topographic contour lines, it only took a matter of seconds.

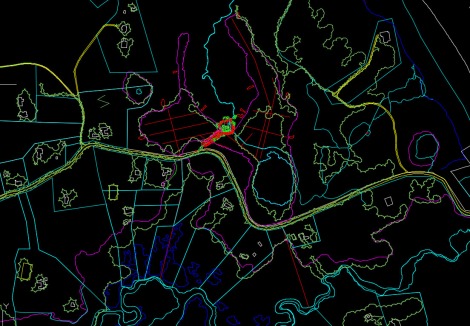
With these combined resources at my disposal and my unfamiliarity with AutoCAD quickly becoming a thing of the past, I’ve been able to complete my “CAD” base map. For someone who came into this internship having never used the program, I’m pretty proud of the progress I’ve made so far! Next up, I’ll be moving my base map into Illustrator to start making it look a little less like a sci-fi candy store and more like a series of overgrown cranberry bogs.
Until then, I’ll leave you with these little beauties!